June 25th, 2026

The second a deployed flow throws an error, you get pinged by email, in-app, or both. The alert tells you exactly which flow, which project, what broke, and gives you a one-click link straight to the failing log.
How it works
Deploy a project or flow, and Lamatic starts watching it. If any flow errors out, you get notified within minutes, not when you happen to check back in.
Email alerts
Include the flow name, the project, the exact error, and a "Check Log" button that takes you straight to the failing run.

In-app alerts
Show up in the bell icon, stacked in order, so you can group multiple errors without leaving Studio. Alerts fire per error within a 5-minute window, close to real time, without spamming you with retries.
You can also set a delivery schedule right from the notification bell. Choose the days you want email alerts, and set the time range for each day. Mute emails overnight or on weekends without missing a thing. Outside that window, email pauses. Critical notifications still reach you every time, regardless of the schedule.

You're in control
Not every alert needs to reach every person, so we built that in too.
Your profile
Has its own notification switch; turn email or in-app alerts on or off for yourself, across every project you're part of.

Project settings
Each project has its own Notifications settings: toggle channels for the whole team and choose exactly which teammates get pinged and on which channel. Three people on the project? Decide individually if each one gets an email, an in-app ping, both, or neither.

June 18th, 2026
Two things in this release. The Lamatic CLI is now on npm. Manage your entire org from the terminal. And logs now show real-time model pricing per run, so you always know what a flow costs.
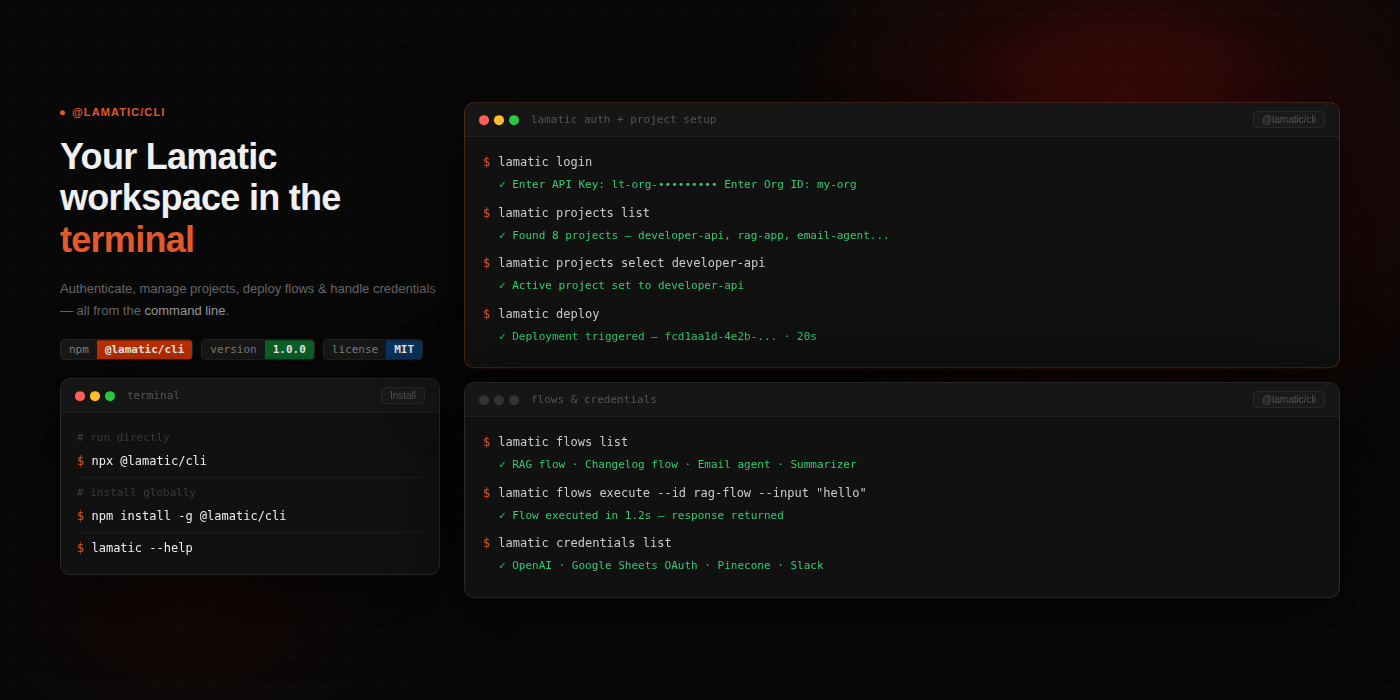
New Lamatic CLI: manage projects, flows, and deployments from the terminal
The official Lamatic CLI is live on npm. Create projects, manage flows, handle deployments, add model credentials and integrations all without opening Studio.
npm install -g @lamatic/cliProjects: create, list, download locally, delete
Flows: create, list, rename, activate/deactivate, delete
Deployments: trigger, list, and inspect deployment details
Contexts: create and manage vector and memory stores
Models & Integrations: add and list credentials

Improved Logs: real-time model pricing per run
The logs list now shows real-time cost per run directly in the table. No more guessing what a flow costs, open Logs and the numbers are right there.
June 3rd, 2026
Two new MCPs in this release. Graph MCP turns your deployed flows into tools your AI agent can call directly. Dev MCP gives Claude, Cursor, and Copilot full control over your Lamatic org projects, flows, credentials, and deployments, all from natural language. And deployment details now show flow tags so you always know what's live.
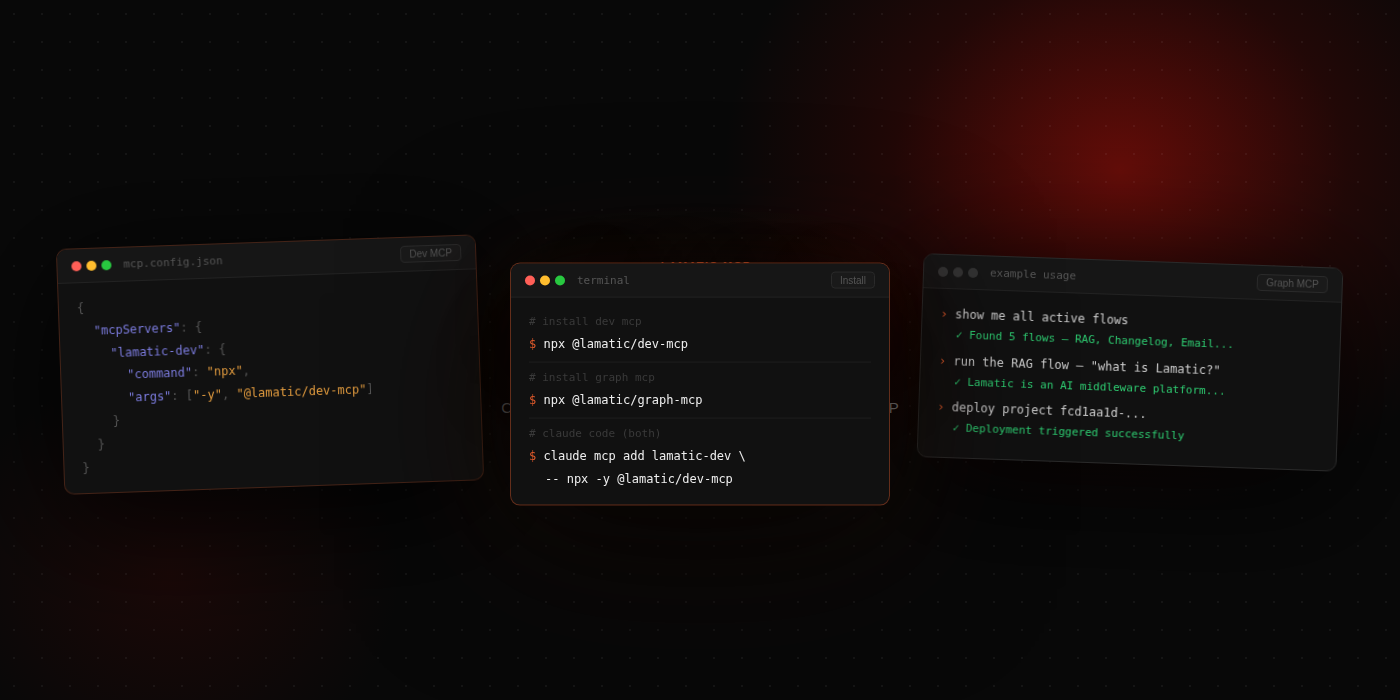
New Graph MCP: run your deployed flows straight from your AI agent

Your deployed Lamatic flows are now executable as tools inside Claude, Cursor, or GitHub Copilot. Point Graph MCP at your project, load your active flows, and your agent can trigger any of them by just describing what it wants to do.
Works with API, Chat Widget, Search Widget, and Webhook triggers
Auto-maps natural language to the right flow and payload
Works with Claude Code, VS Code, Claude Desktop, Cursor and more
New Dev MCP: manage your entire Lamatic org from your editor

Dev MCP gives your AI agent hands-on access to everything in your Lamatic org. Create projects, build and update flows, manage credentials and handle deployments without opening Studio.
Projects: create, rename, deploy, and delete
Flows: create, update nodes and edges, activate, deactivate
Credentials: add and manage model and integration credentials
Contexts: create and manage vector and memory stores
And more
Improved Deployments: flow tags are now visible in deployment details

When you deploy a project, deployment details now show the tags attached to each flow, making it easier to filter, identify, and track what's live.
May 26th, 2026

Two things in this release. The Tables Node provides full CRUD operations for structured data directly within your flows. And when a flow fails, logs now show you exactly which node broke and why.
New Tables Node: query, insert, update, and delete without leaving Studio
You can now read and write structured data inside any flow using the Tables Node. It connects directly to your Lamatic Data Tables and handles the full range of operations, no external database tooling needed.
Select rows with filters, sorting, and pagination
Insert single or multiple records from flow data
Update records matching a where clause
Delete records by condition
Raw SQL for anything the visual builder doesn't cover

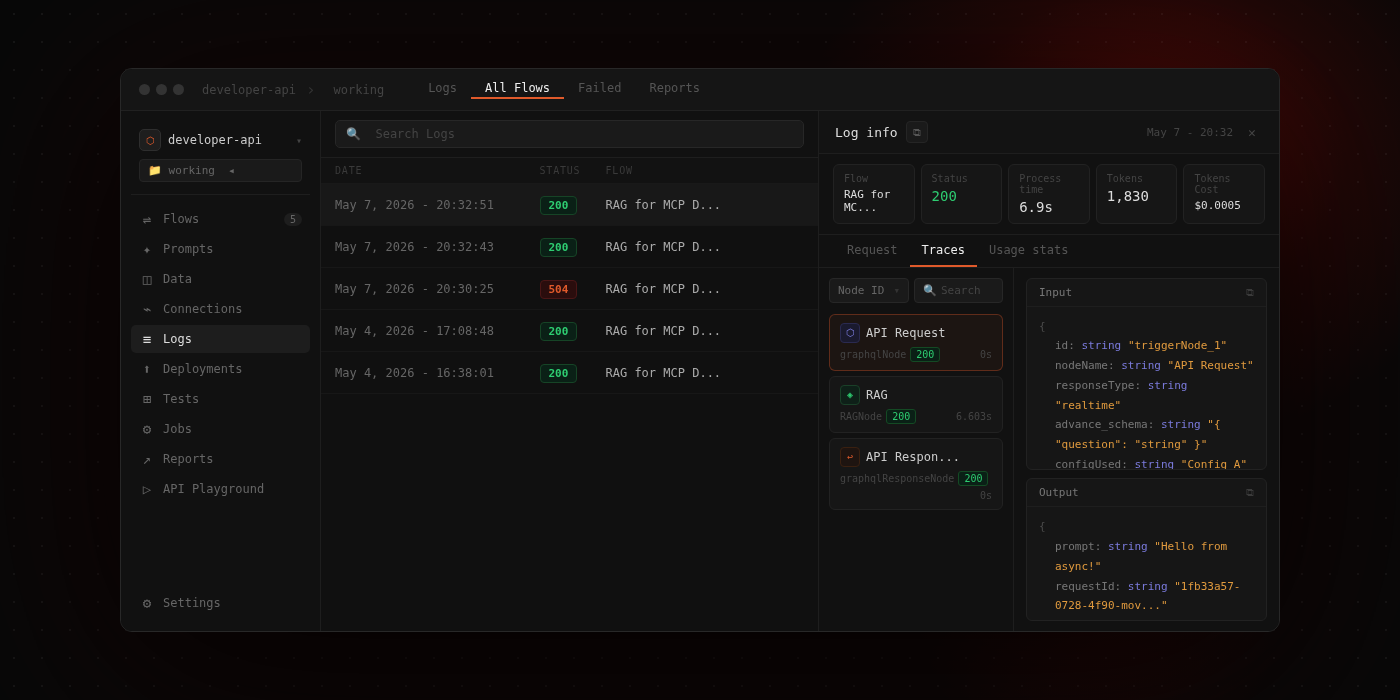
Improved Logs: per-node error details when a flow fails
When a flow runs and hits an error, the log detail view now shows you the exact node that failed and the specific error it threw, such as input, output, and error message, all in one place. No more guessing which step broke.
May 20th, 2026
Three things in this release. Log details load faster with a redesigned view. The debugger gets UX changes that make quality testing cleaner. And the Lamatic Docs MCP is live; query the docs from Claude, Cursor, or Windsurf without leaving your editor.
New Docs MCP: query Lamatic docs from your AI assistant
The Lamatic Docs MCP gives Claude, Cursor, Windsurf, and any HTTP MCP client direct access to Lamatic documentation, powered by a RAG pipeline built on Lamatic itself. No API key, no account required.
Works with Claude Desktop, Cursor, Windsurf, Cline and more
Single tool: Ask any question, get a precise answer with references
Improved Log details: faster load, cleaner trace view
Log detail pages have been redesigned to load faster and make it easier to follow the full trace of a request.
Faster load times across all log detail views
Redesigned layout that makes request traces easier to scan
Clearer node output display for quicker root cause identification
Improved Debugger: flow quality testing that stays out of your way
The debugger UX is tightened up so testing a flow feels less like a separate task and more like part of building. Spot issues, iterate faster, move on.
Streamlined interface with less friction between triggering a test and reading the result
Better output readability in debug mode across complex flows
May 5th, 2026
Four updates this release. Doc Extractor gets a Gemini patch, S3 works in action mode now, AgentKit moves to GitHub for community contributions, and logs got a serious performance upgrade under the hood.
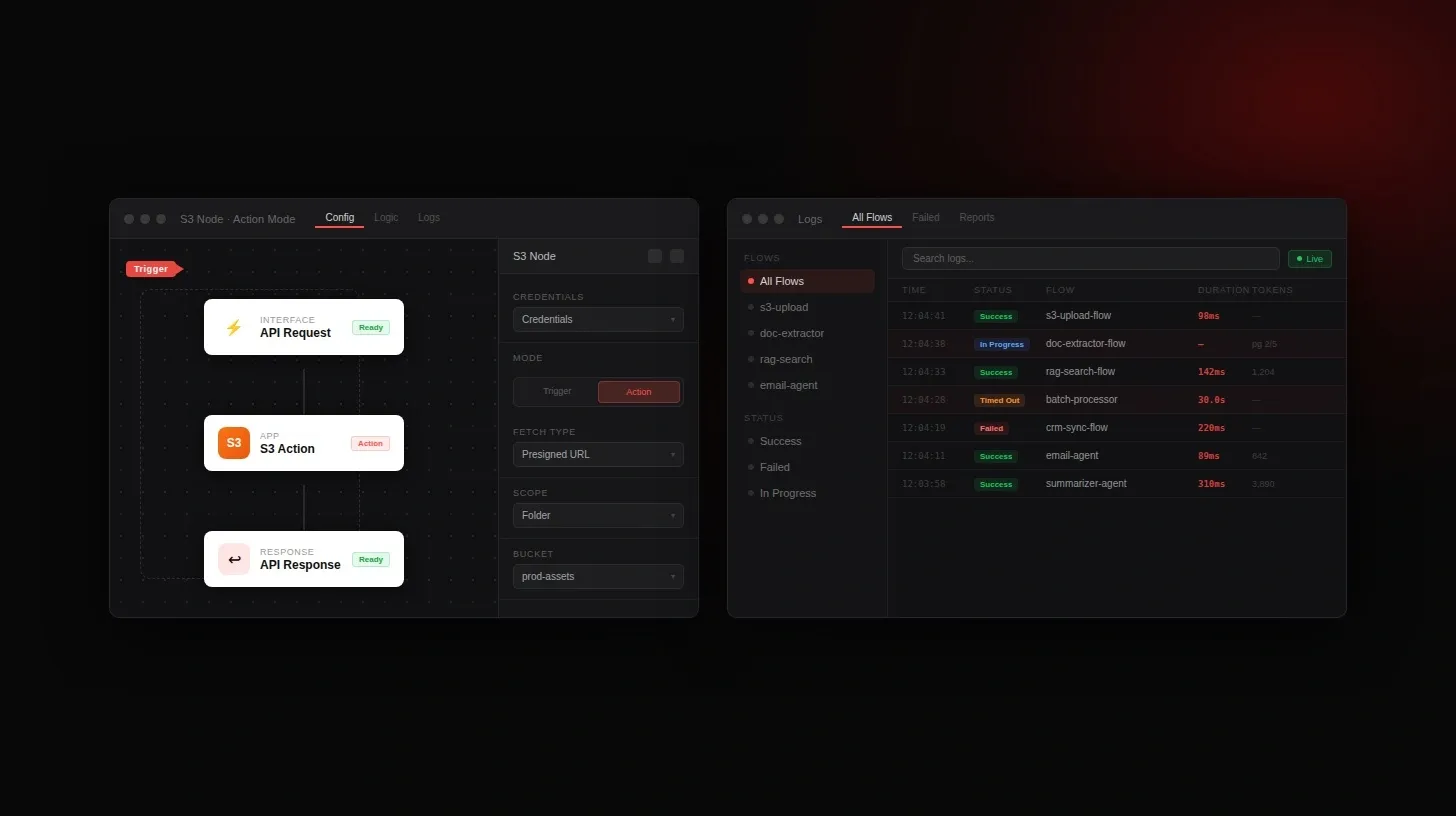
Improved S3 Node: action mode is now available.
The S3 node used to work as a trigger only. You could kick off flows when files landed in S3, but you couldn't fetch files on demand mid-flow. Action mode closes that gap.
Presigned URLs: Fetch a presigned URL for any specific file in your S3 bucket
Folder-Level Access: Pull presigned URLs for all files inside a folder in one step
Action Mode: Use S3 as an on-demand data source anywhere inside your flow, not just as a trigger
Improved Doc Extractor: custom Zod schema support now works with Gemini.

Last week's Doc Extractor release shipped structured extraction for most models. Gemini users hit a wall with custom schemas. That is patched now.
Custom Schema Support: Define your own Zod schema and get structured output from Gemini exactly as specified
Full Extraction Suite: Raw text, document annotations, and structured data all supported across PDFs and images
Smart Chunking: PDFs are processed in 30-page chunks so large documents don't break your flowMulti-Page Documents: Combine multi-page outputs or process page by page
New AgentKit is now on GitHub. Build it, use it, contribute to it.
AgentKit kits and templates are now community-driven and live on GitHub. Browse what the community has built, use what fits, and contribute your own.
April 29th, 2026
New
Two new nodes this release. Doc Extractor brings LLM-powered document extraction natively into your flows. MSSQL brings direct database access into Studio. Plus a round of fixes that were affecting real workflows.
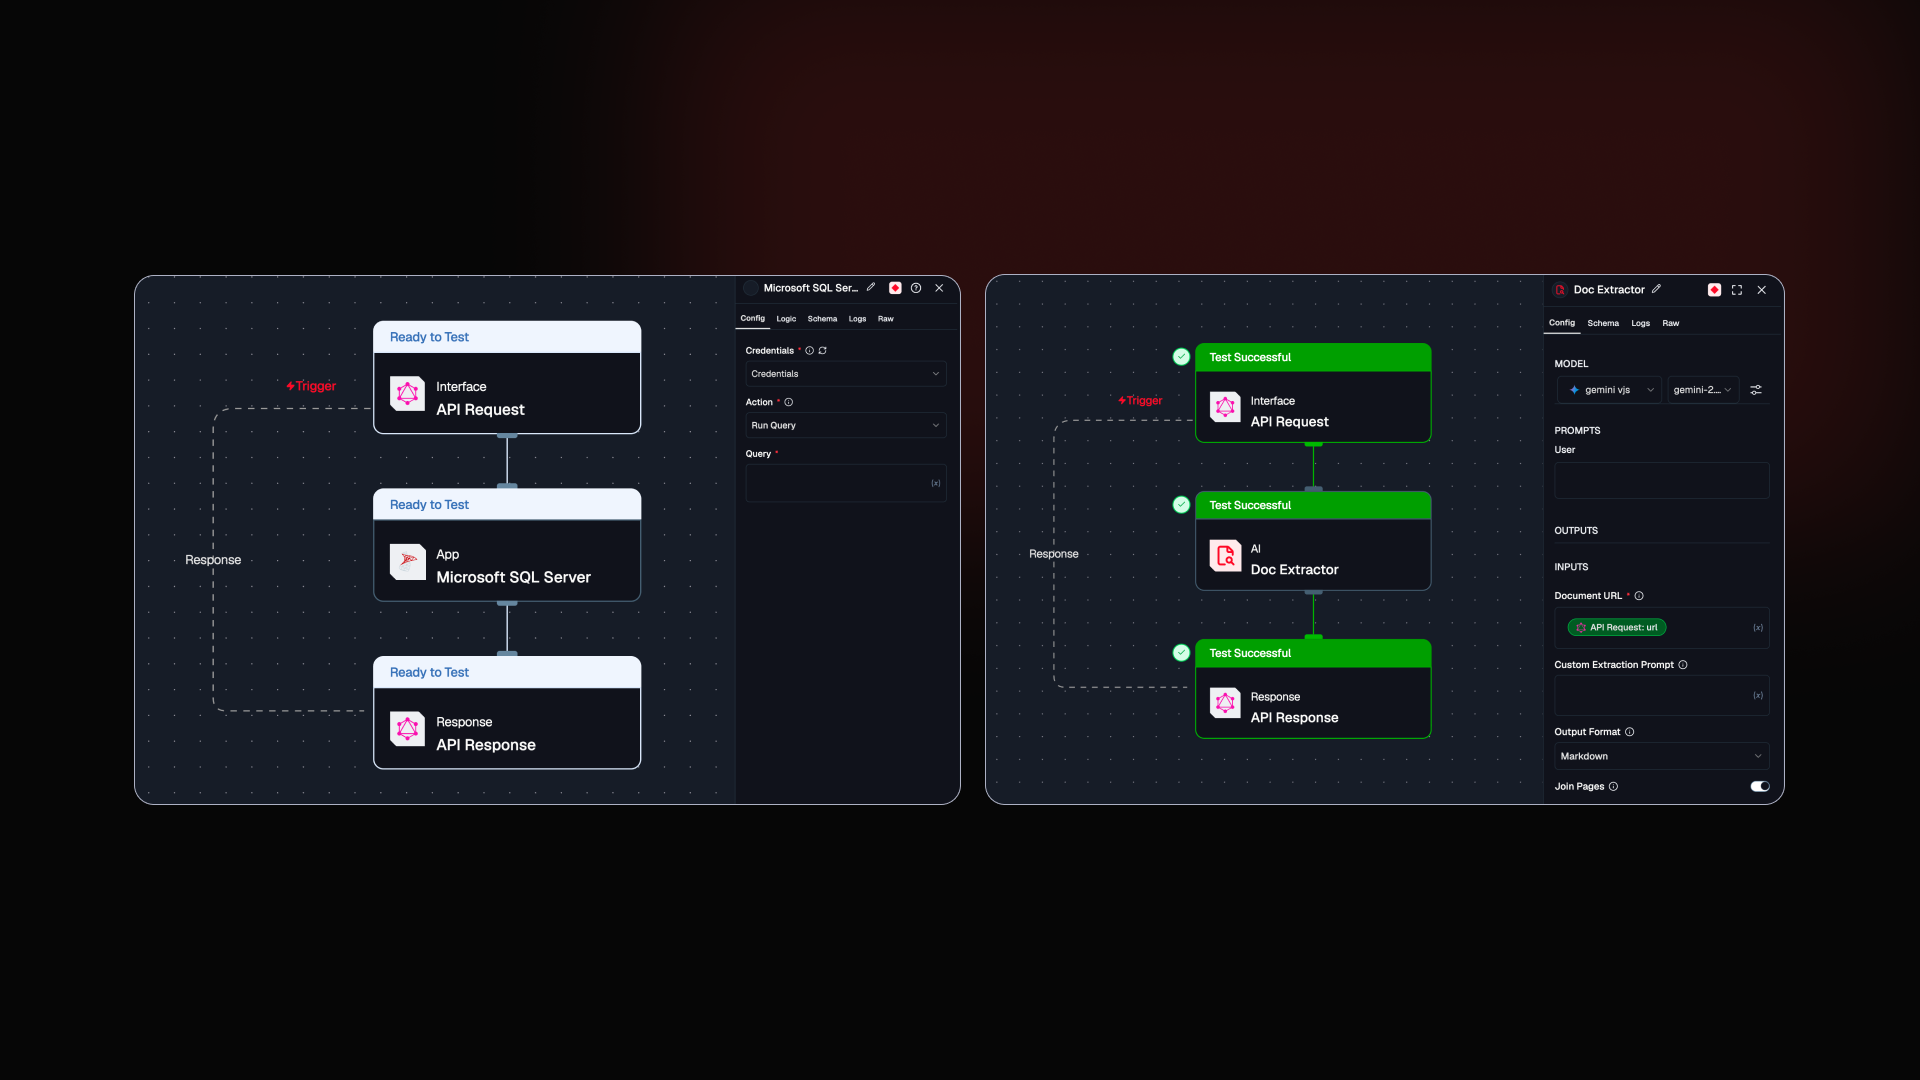
New Doc Extractor Node: pull structured data from any document, right inside your flow.

Extracting structured data from PDFs and images used to mean stitching together OCR tools, custom parsers, and manual cleanup before anything useful came out. The Doc Extractor node does all of that inside Lamatic, in one step, using an LLM prompt you control.
This one came from the team hitting the same wall repeatedly while building document-heavy workflows.
PDF and Image Support: Extract from any document using a URL
Prompt-Controlled Extraction: Define what to extract and how to format it using a plain prompt
Flexible Output: Returns JSON, markdown, or plain text ready for downstream nodes
Multi-Page Documents: Combine multi-page outputs or process page by page
New MSSQL Integration: query your database without leaving Studio.

Testing queries against MSSQL used to mean switching between external tools, validating data outside your workflow, then bringing results back in. You can now connect directly to your MSSQL database from inside Studio and run queries in the same place you build.
Dedicated MSSQL Node: Connect with credential configuration built in
Query Editor: Write and execute SQL queries directly inside the node
Live Results: View query output inside Studio as you build
Connection Testing: Verify your database connection without leaving the platform
Improved Four fixes. All of them were affecting real workflows.
Stripe Subscriptions: Subscription access issues with Stripe are now handled correctly, reducing unexpected access problems
Templates: Fixed cases where templates were not loading or being found correctly
Keyboard Navigation: Smoother focus behavior across forms for faster, more accessible input
Loading States: Clearer indicators when actions are in progress so you always know what Studio is doing
April 21st, 2026
Improved
We found gaps in how token usage and costs were calculated, and deployments needed better structure at scale. This release closes both.
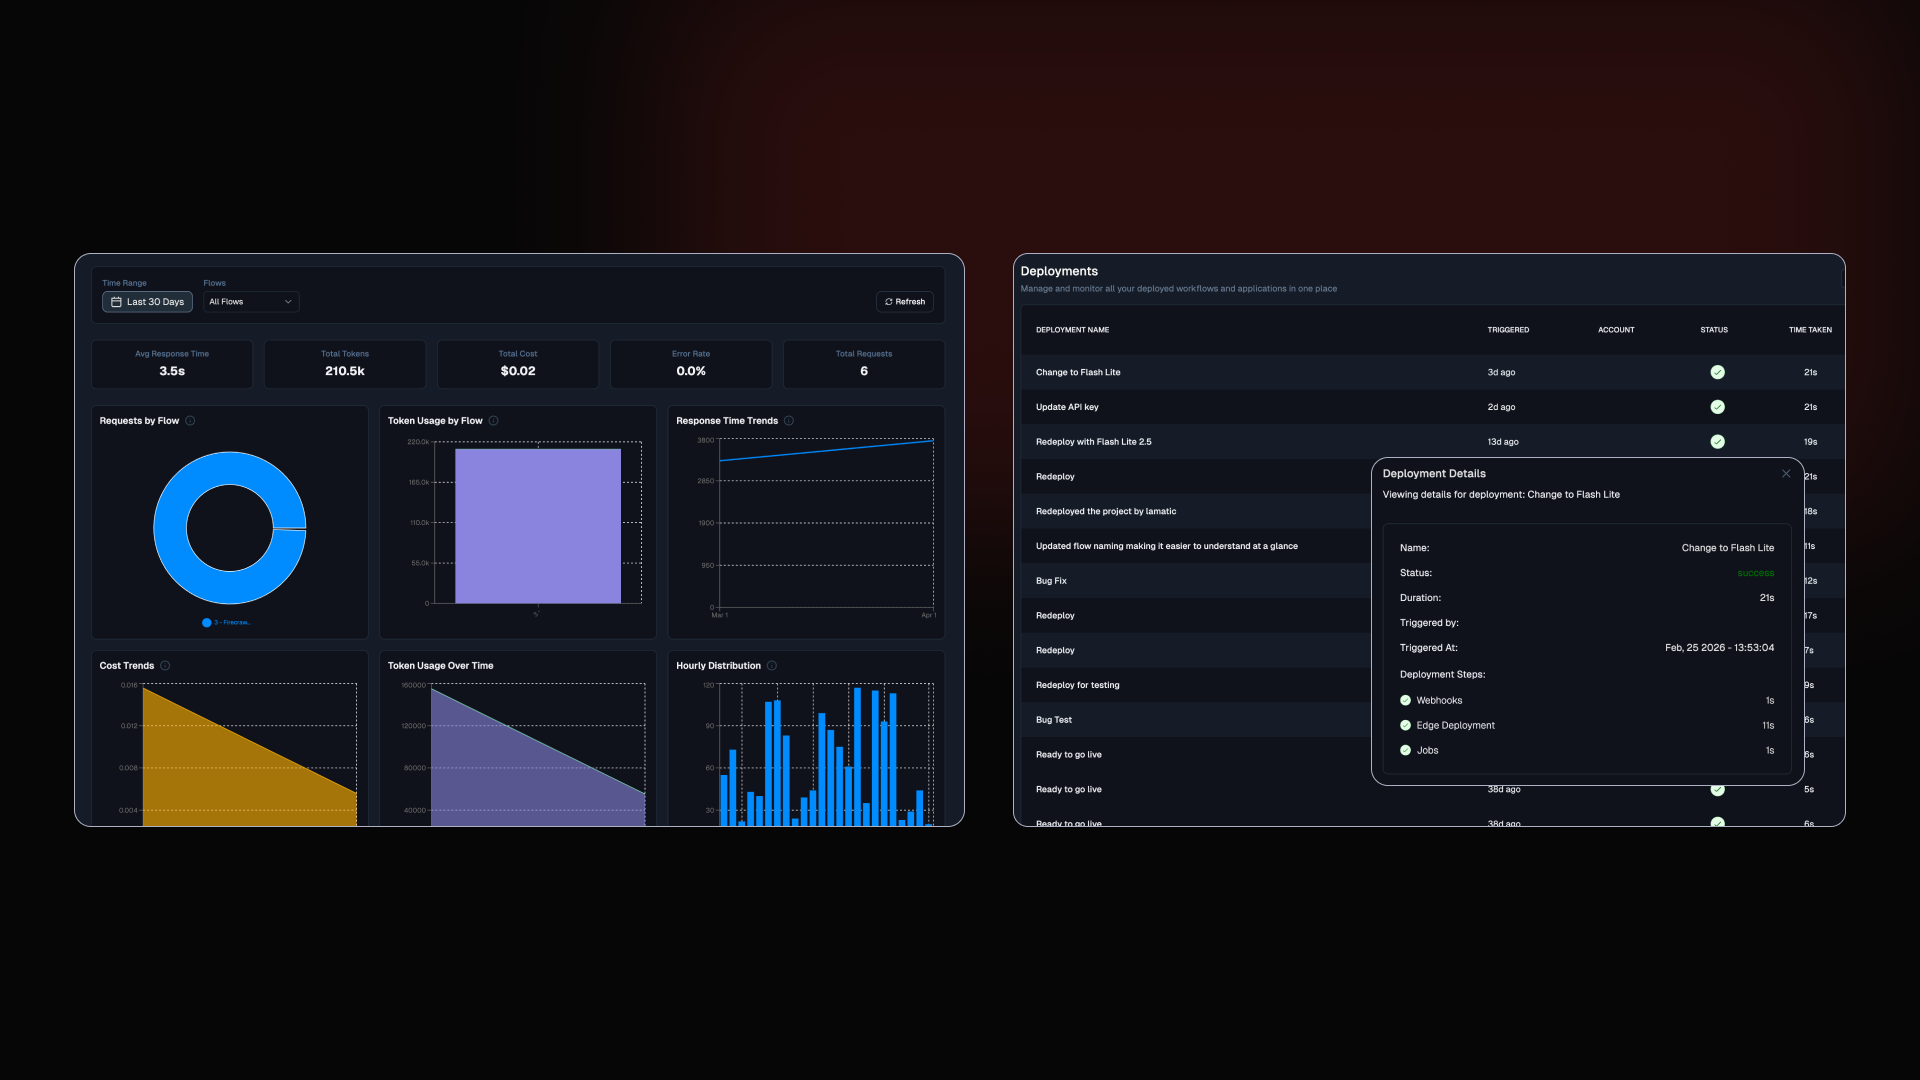
Improved Analytics accuracy: every request now counts.

Token usage and cost metrics now include every request state, successful, failed, or incomplete. Calculations are consistent across logs, dashboards, and reports so your numbers tell the same story everywhere.
All Requests Counted: Successful, failed, and incomplete requests all factor into your metrics now
Unified Aggregation: Same calculation logic across logs, dashboards, and reports
Reliable KPIs: Requests, tokens, and cost figures now align everywhere you look
Deployments: structured, paginated, and predictable now.

As deployment lists grew, navigation got harder. The deployment experience is now rebuilt around scale so you always know where you are and what shipped last.
Newest First: Latest deployment always surfaces at the top
Pagination: Clean navigation across large deployment lists
Total Count: Full visibility into deployment volume at a glance
Stable Loading: List no longer resets while fetching more entries
Under the hood: faster queries, smoother daily workflows.
A round of internal improvements to the data layer, filtering, and UI. Queries are faster, aggregation logic is simpler, and the small friction points in logs and filtering are cleaned up.
March 31st, 2026
The node library is at 40+ and growing, so we rebuilt the selector to keep up. Keyboard navigation, recently used nodes, cleaner tooltips. The Prompt Editor also gets better controls this release.
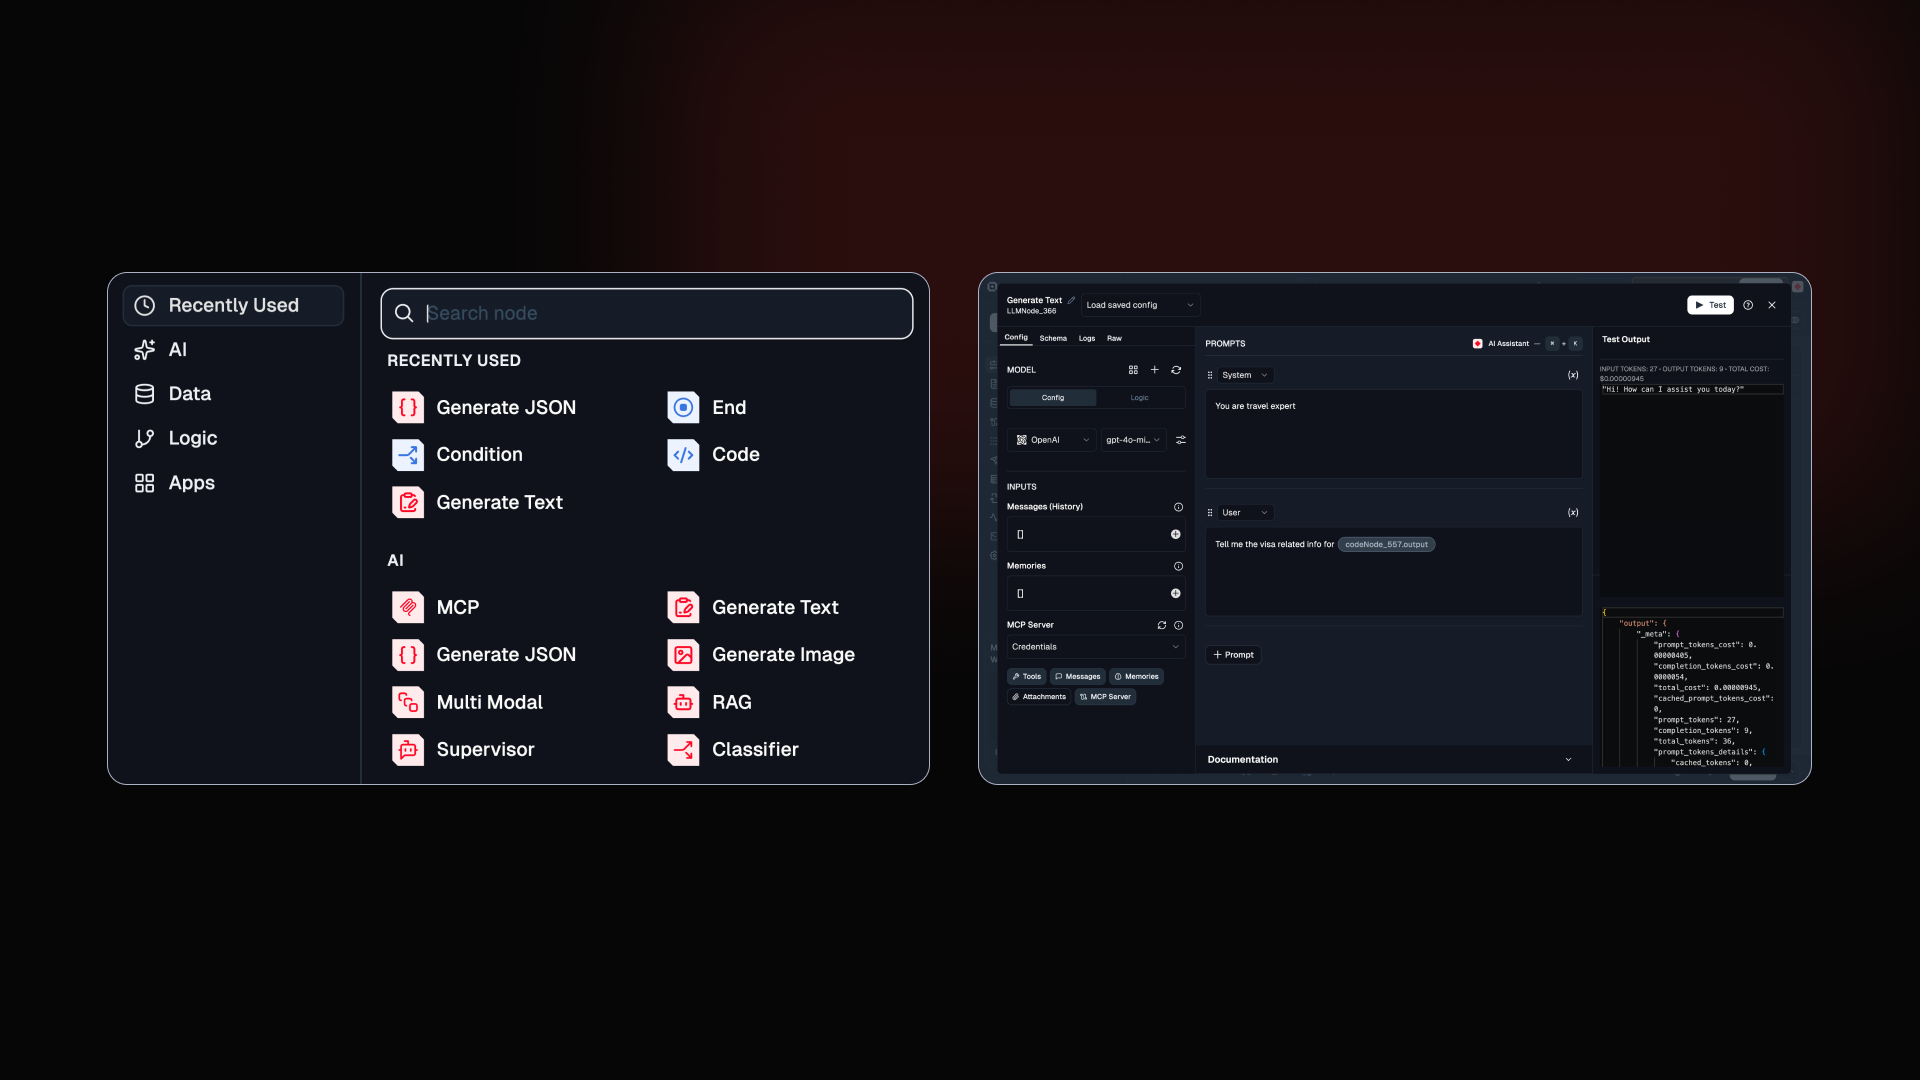
New We rebuilt the node selector for a library that keeps growing.

As the number of nodes in Lamatic grew, the old selector didn't grow with it. Finding the right node took longer than it should. The new one is built for the library we have now, and the one we're still building.
Recently Used Nodes: Your most used nodes surface at the top so you're not hunting every time
Keyboard Navigation: Navigate and select nodes without touching the mouse
Clearer Tooltips: Hover over any node for a clean, readable description before you add it
Scalable Layout: Redesigned to stay fast and accessible as the node library keeps expanding
Improved Prompt Editor: small changes, big usability wins

Prompt Editor continues to evolve with better guidance and cleaner controls, making it easier to manage configurations inside agents and workflows.
These updates focus on reducing confusion and improving day-to-day usability.
Quick Actions: Added remove/delete buttons with tooltips for configuration items
Guided Inputs: Instructional tooltips for inserting variables
Better Visibility: Improved configuration item management
March 24th, 2026
New
Improved
Two big ones this release. Batch Node brings parallel execution to your flows, making them faster. The Prompt IDE is rebuilt from the ground up. Plus a round of smaller improvements across logs, docs, and the editor.
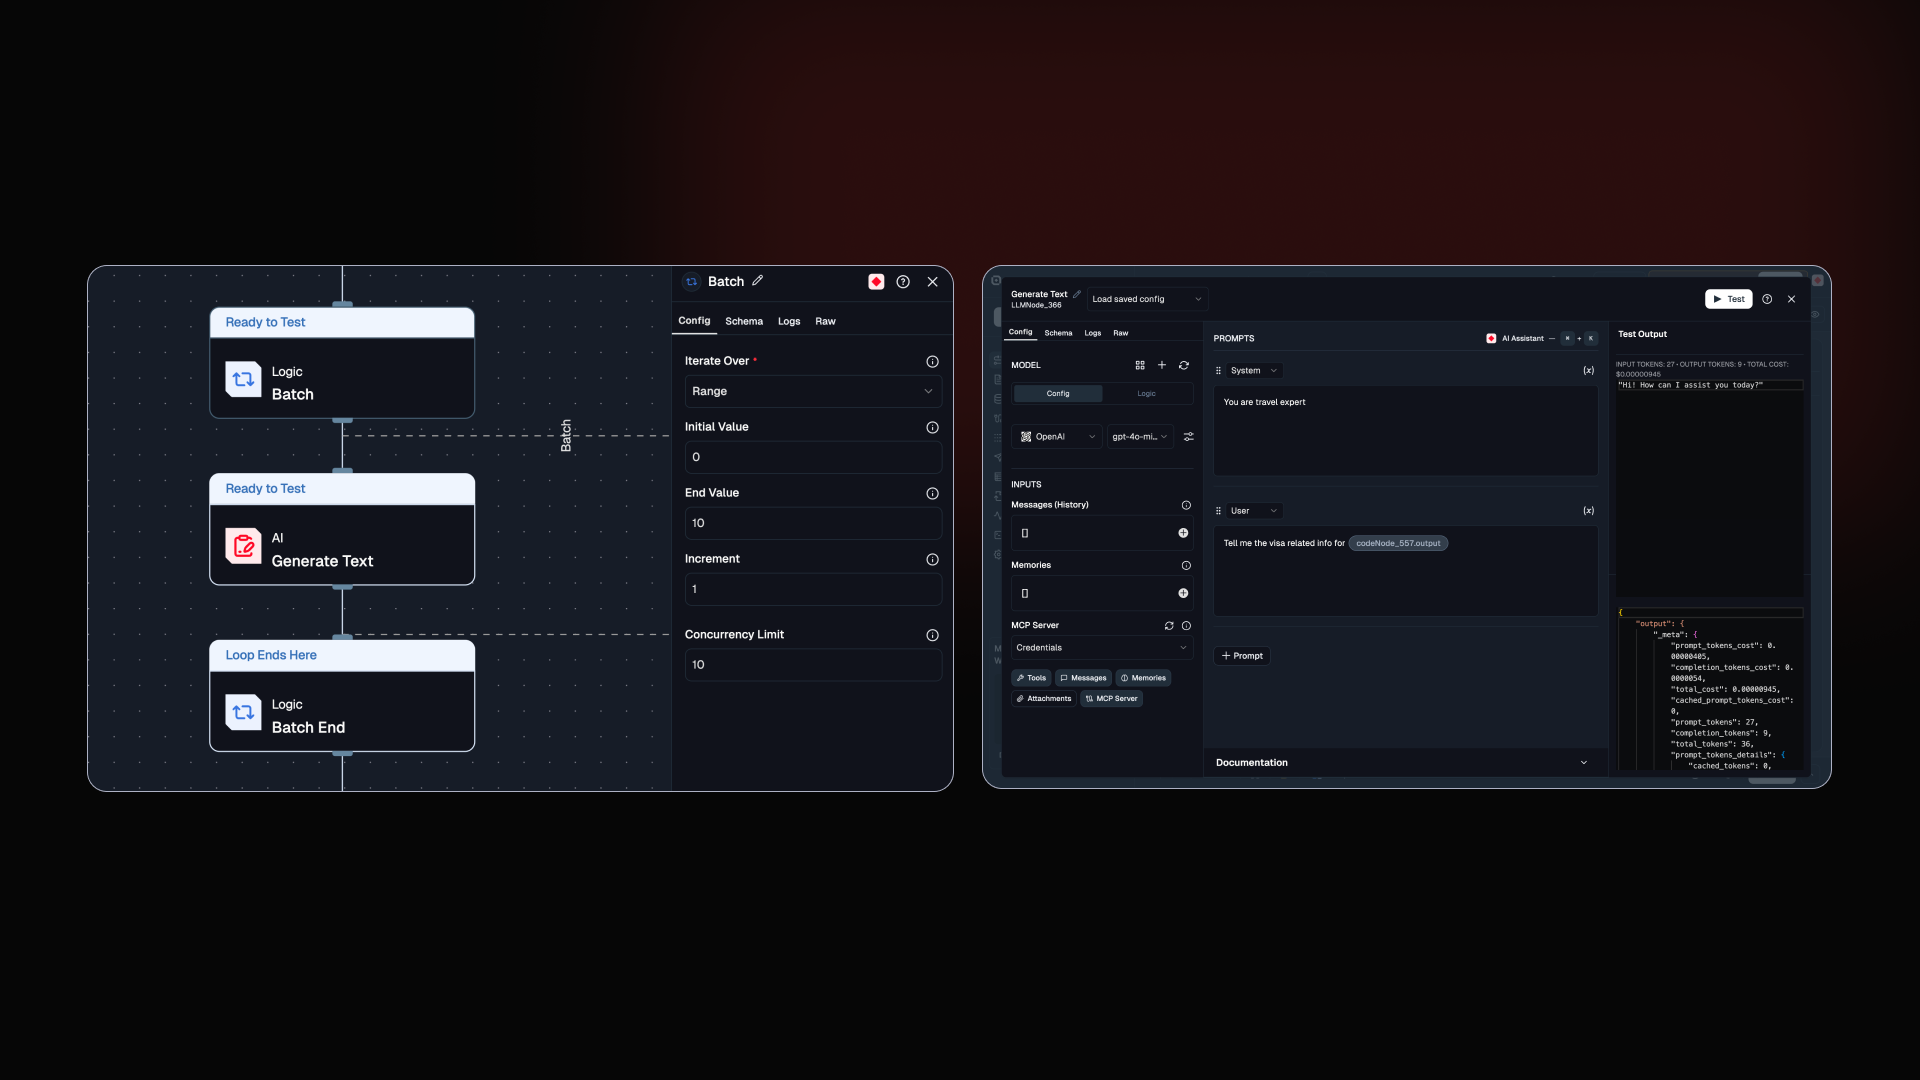
New Batch Node: your Agents can now run in parallel.

The Loop node processes one item at a time. Batch Node processes all of them at once. The difference is not subtle: 100 tasks that take 50 seconds sequentially finish in 5 seconds at a concurrency of 10. For I/O-bound workflows, that is a 5 to 10x speed improvement out of the box.
Built for the people who watched Loop nodes crawl through large datasets and wondered if there was a better way. There is now.
Parallel Execution: Processes multiple iterations at the same time instead of one by one
Concurrency Control: Set a limit to scale fast without hitting rate limits or overloading downstream services
Lists and Ranges: Works with both list inputs and numeric ranges
New The Prompt IDE is rebuilt. Write, test, and see costs all in one place now.

Prompt engineering now has a proper home in Lamatic. Structured blocks, an AI assistant working alongside you, and instant cost feedback before anything goes to production. All in one screen.
This came from watching people bounce between the editor and external tools just to test one prompt.
System and User Blocks: Separate role-based sections so your prompt structure is clear from the start
Prompt Assistant: Writes and refines prompts alongside you, right inside the editor
Instant Testing: Run prompts in real time and see output, token usage, and cost before your flow ever deploys
Improved Five things we shipped this week. Some small. All worth it.
Docs: Copy any page as Markdown or open it directly in Claude or ChatGPT. Less tab switching, faster iteration
Dark Mode: Cleaned up styling on AI suggestion buttons and separators
Node Config: Better node configuration layout and a cleaner Code IDE
Text Rendering: Text no longer overflows or wraps awkwardly in prompts and logs
Code Editor: Removed variable previews and auto-formatting for a more stable editing experience